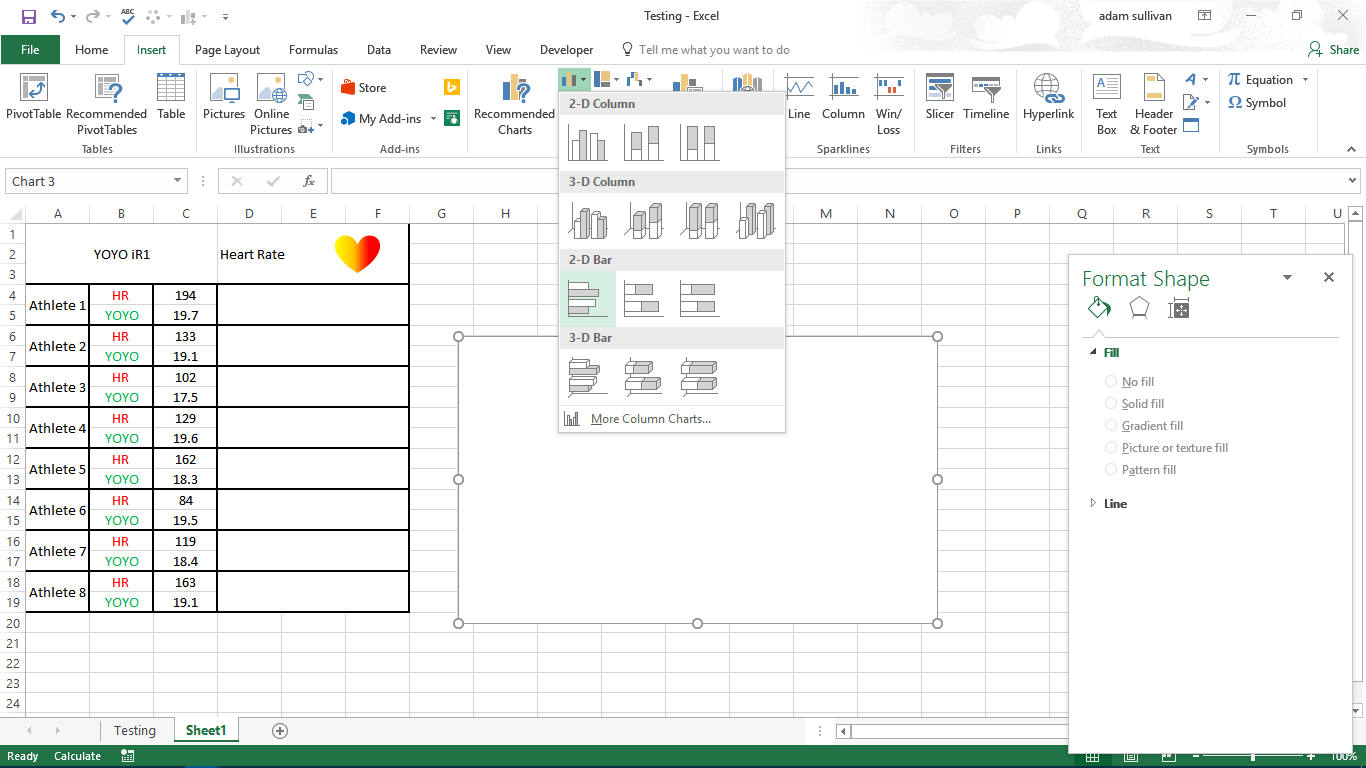
Using a simple bar chart, playing around with how it’s formatted and presented and you can create some cool progress bars to display things like intensity or highlight any variable that has a beginning and end value!


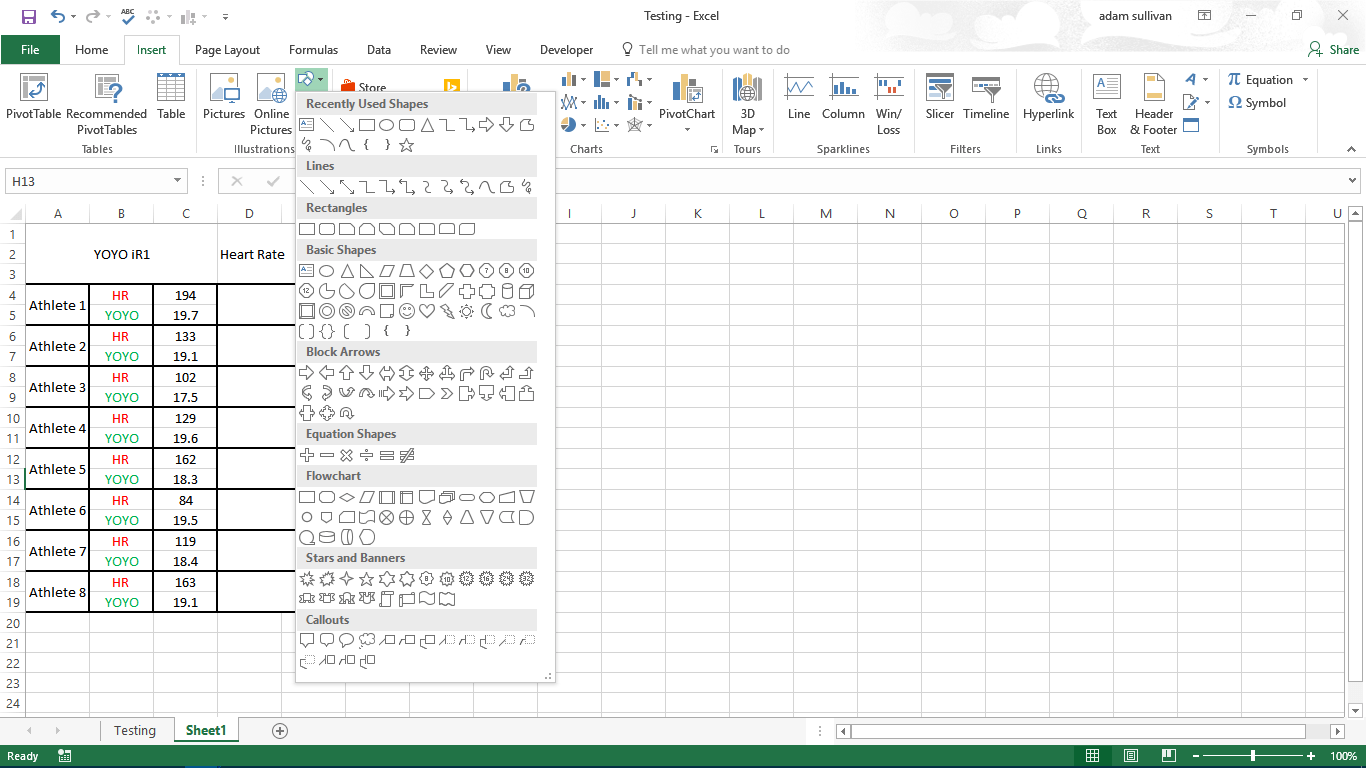
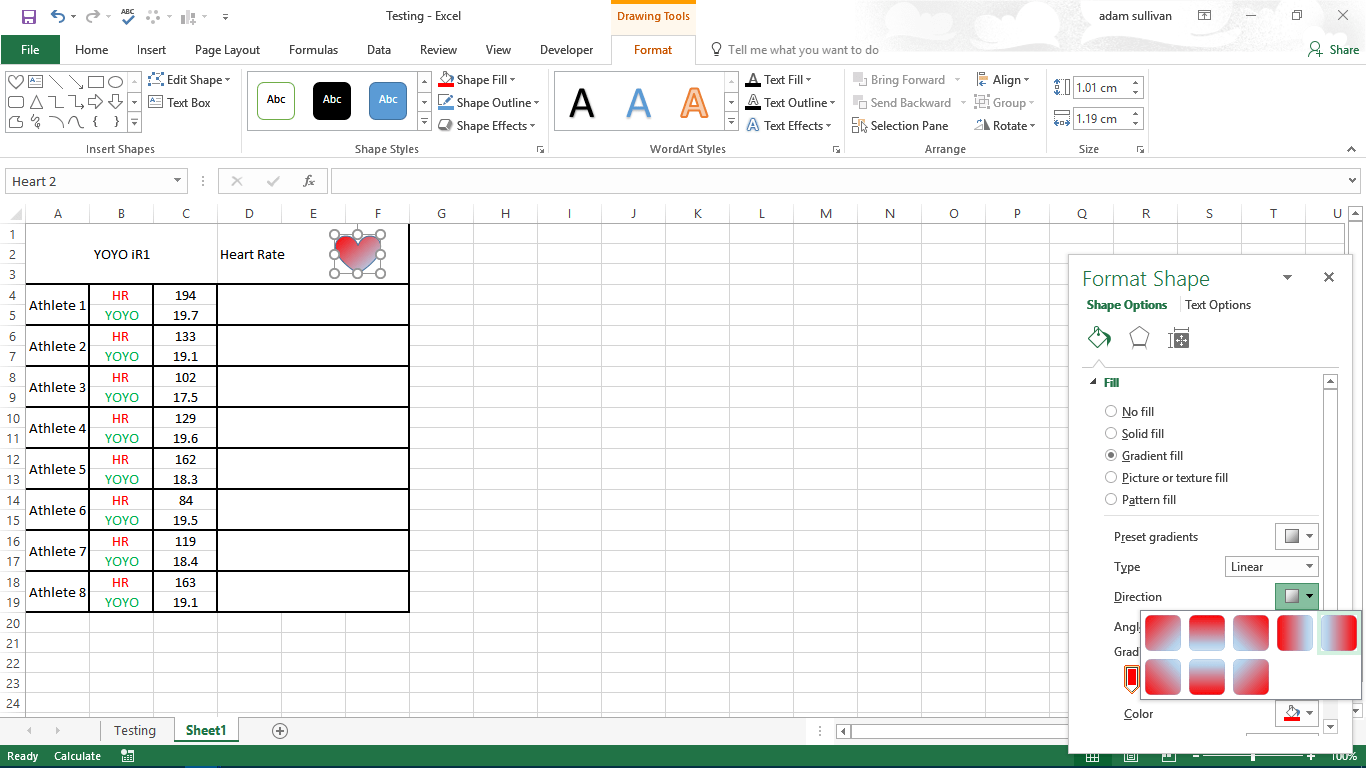
To create heart symbol beside heart rate simply insert the heart shape and format to your liking.
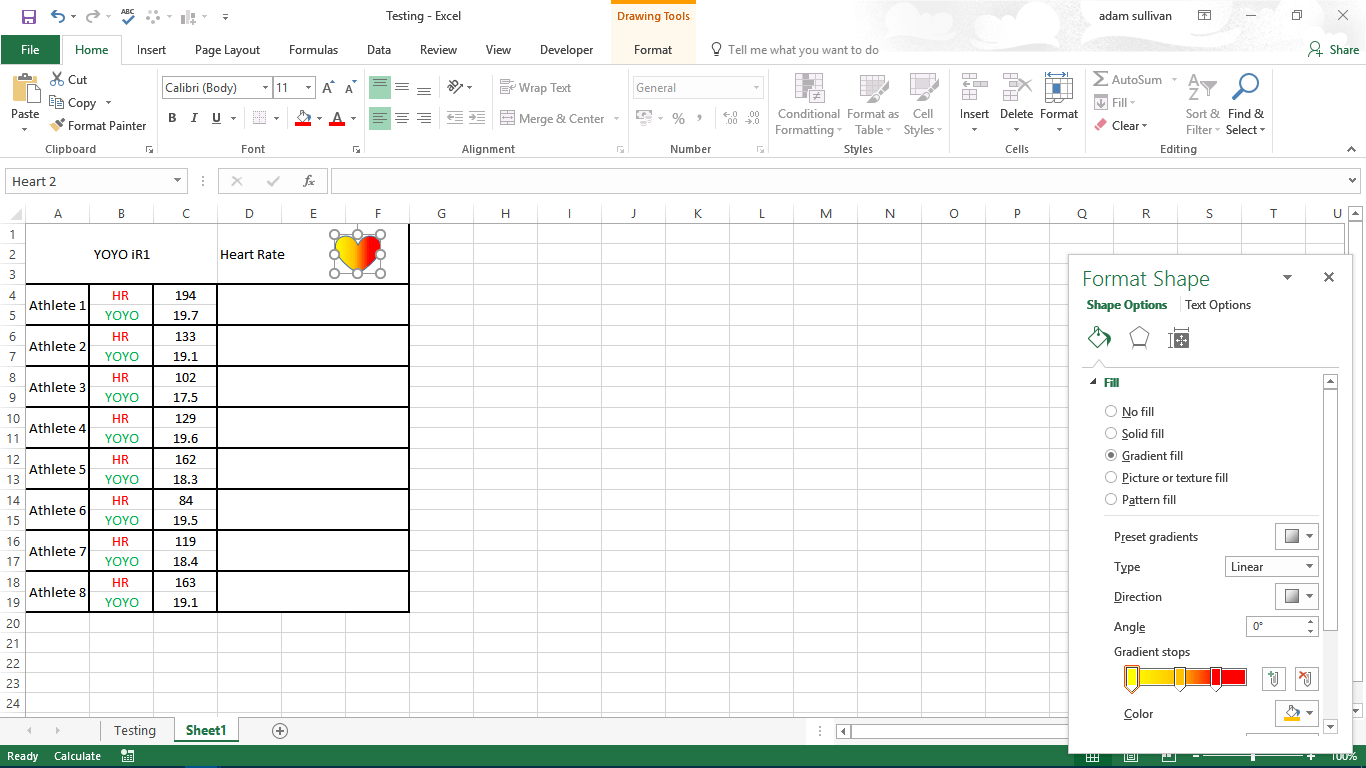
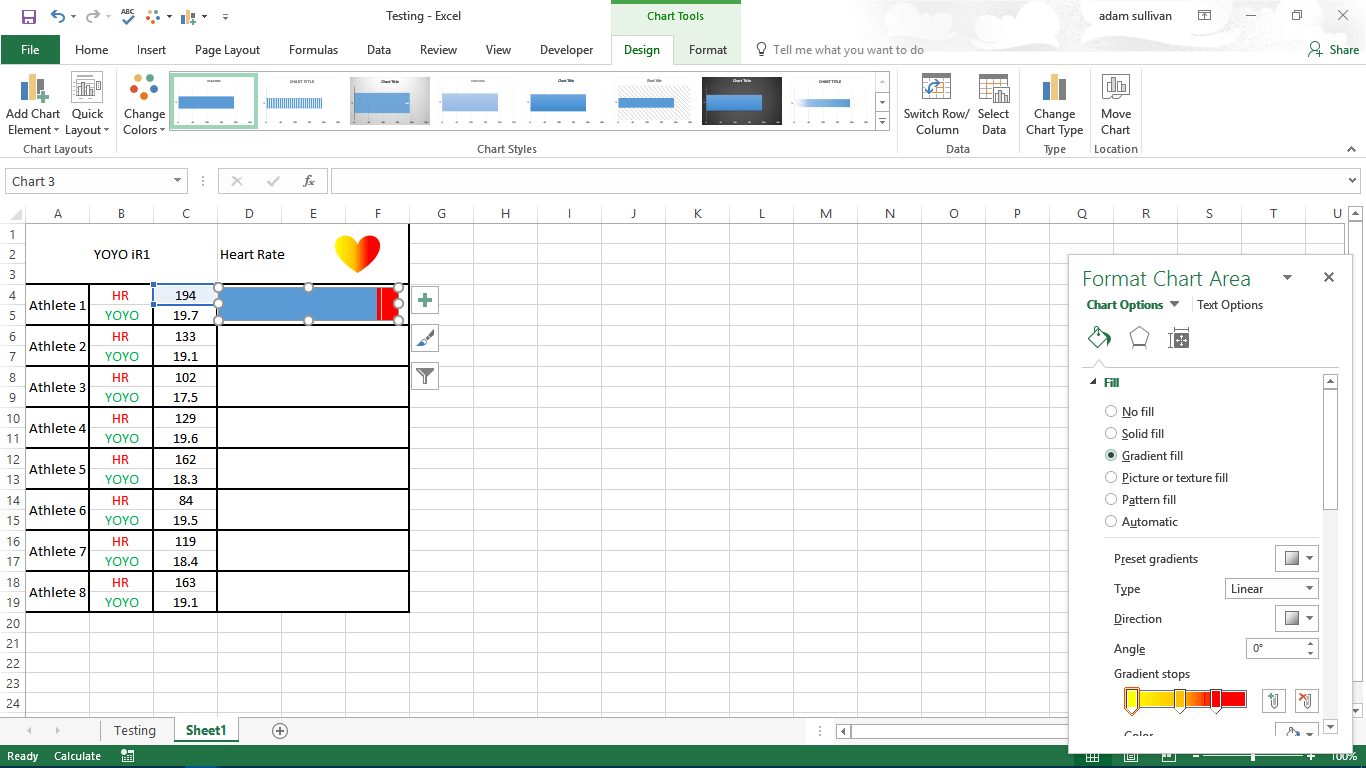
To get the gradient fill, select gradient fill in the format shape box, select the colour transition you want using the sliding scale and pattern position.

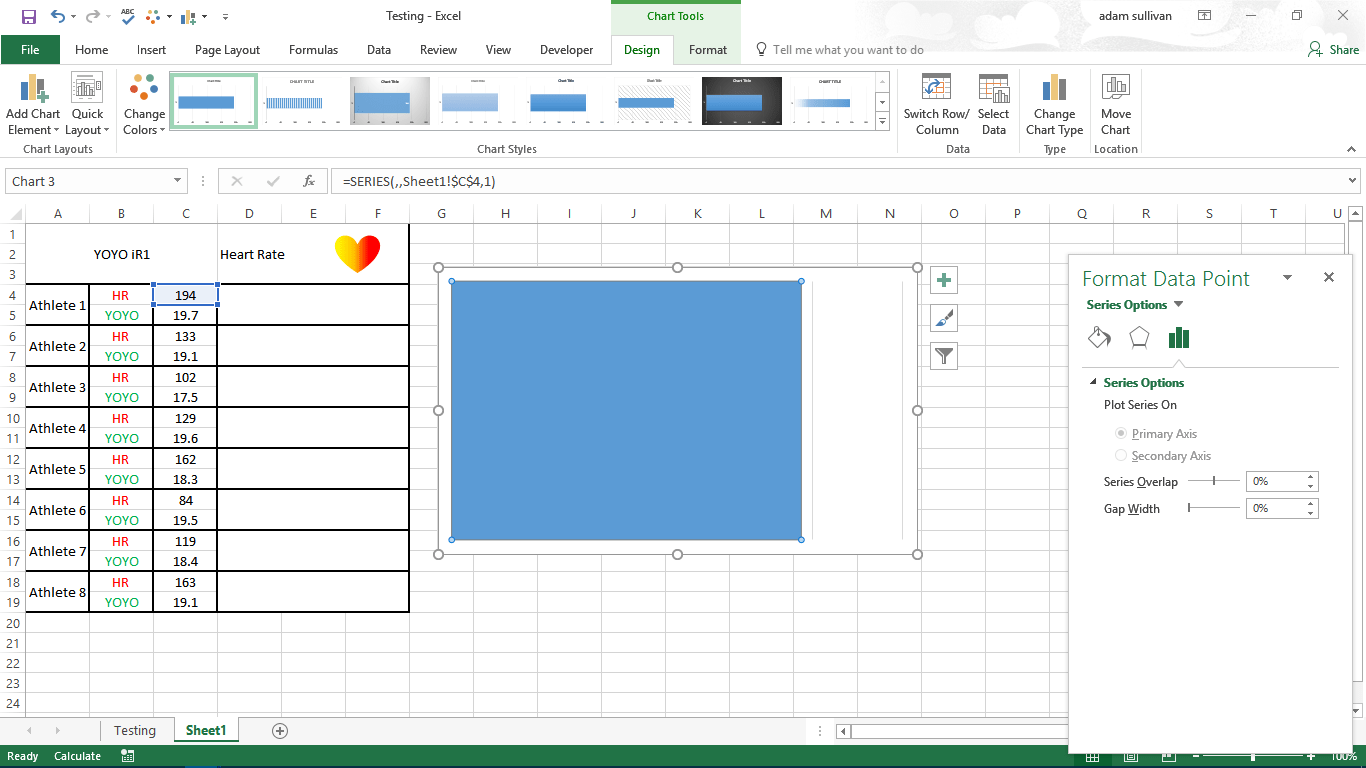
For the custom progress bar, you will use a bar chart for each heart rate figure.

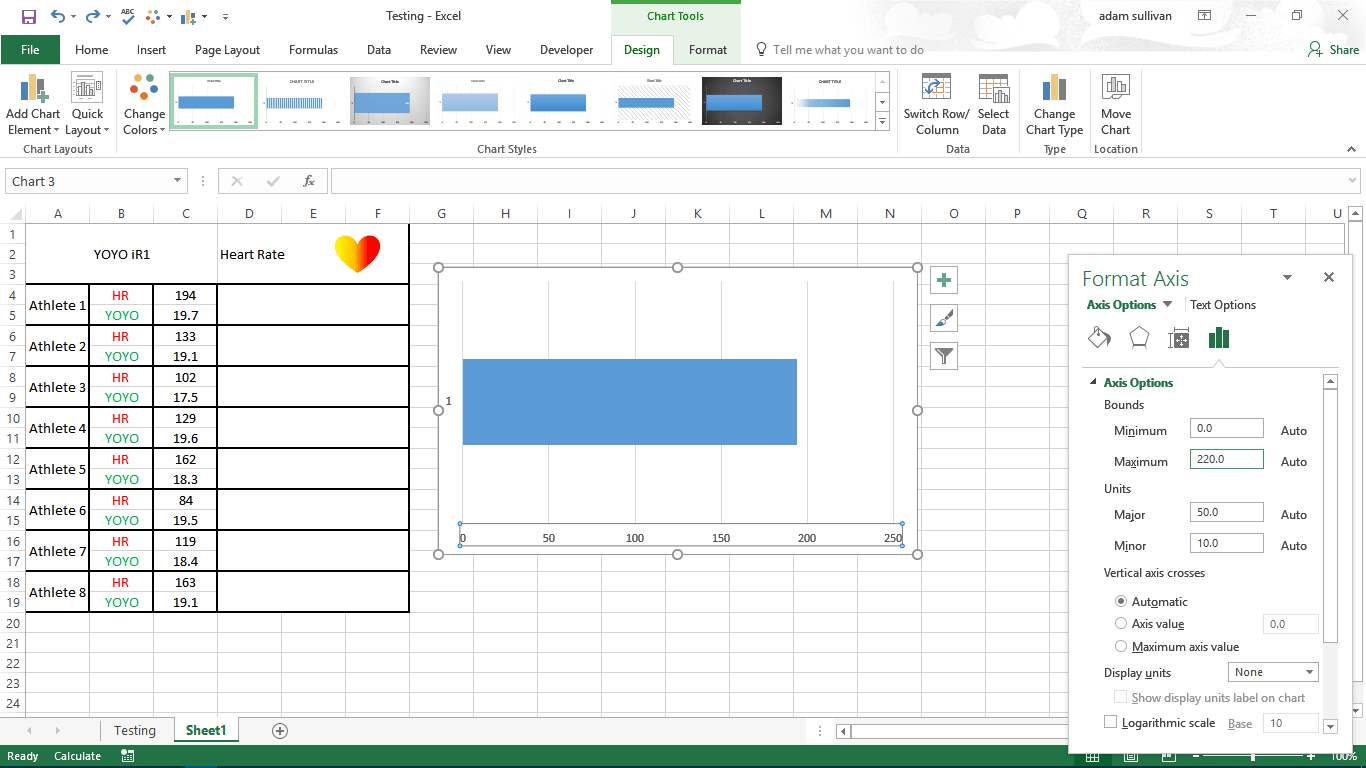
Be sure to set an appropriate range on the horizontal axis, so your bar has a scale to work from. Once your axis is set you can delete the axis display from the chart
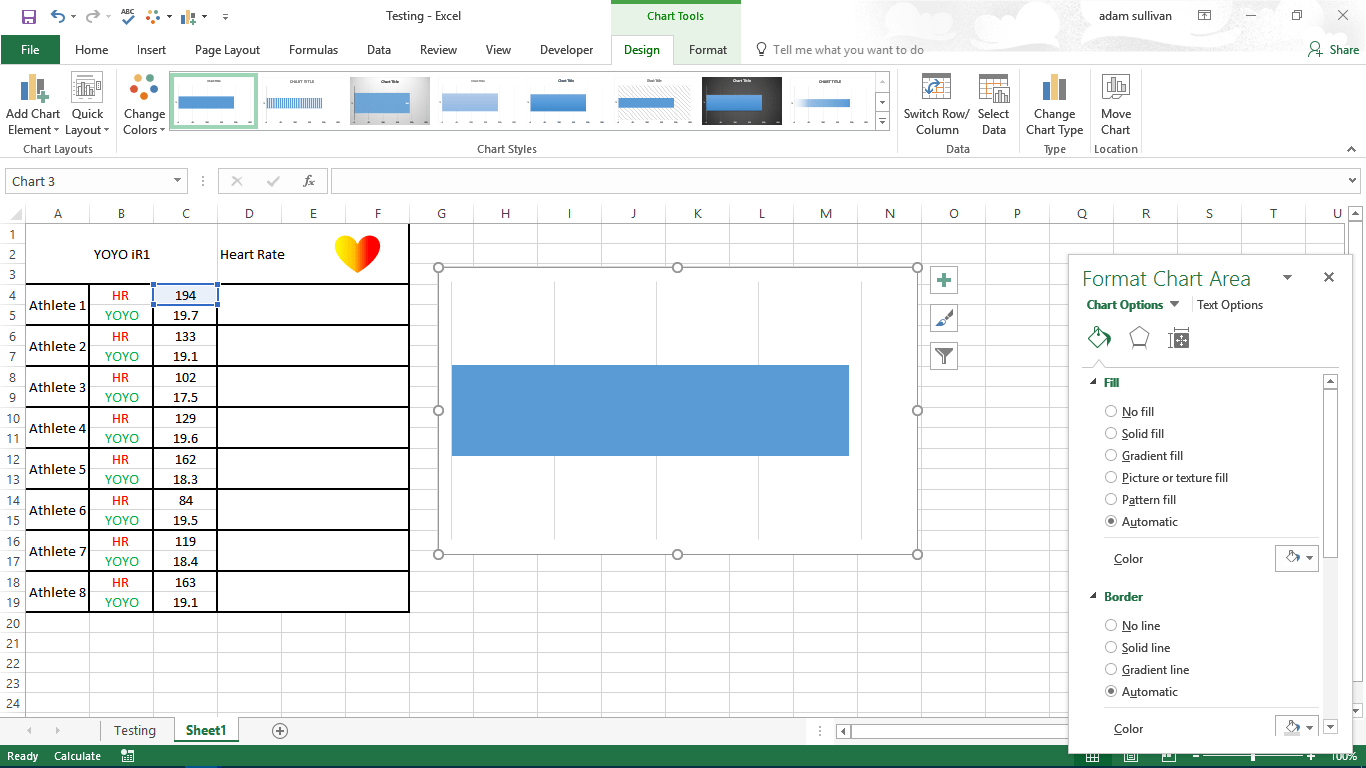
Then you need to make sure you click the chart plot area and drag it so that it’s border matches up with the chart area border.
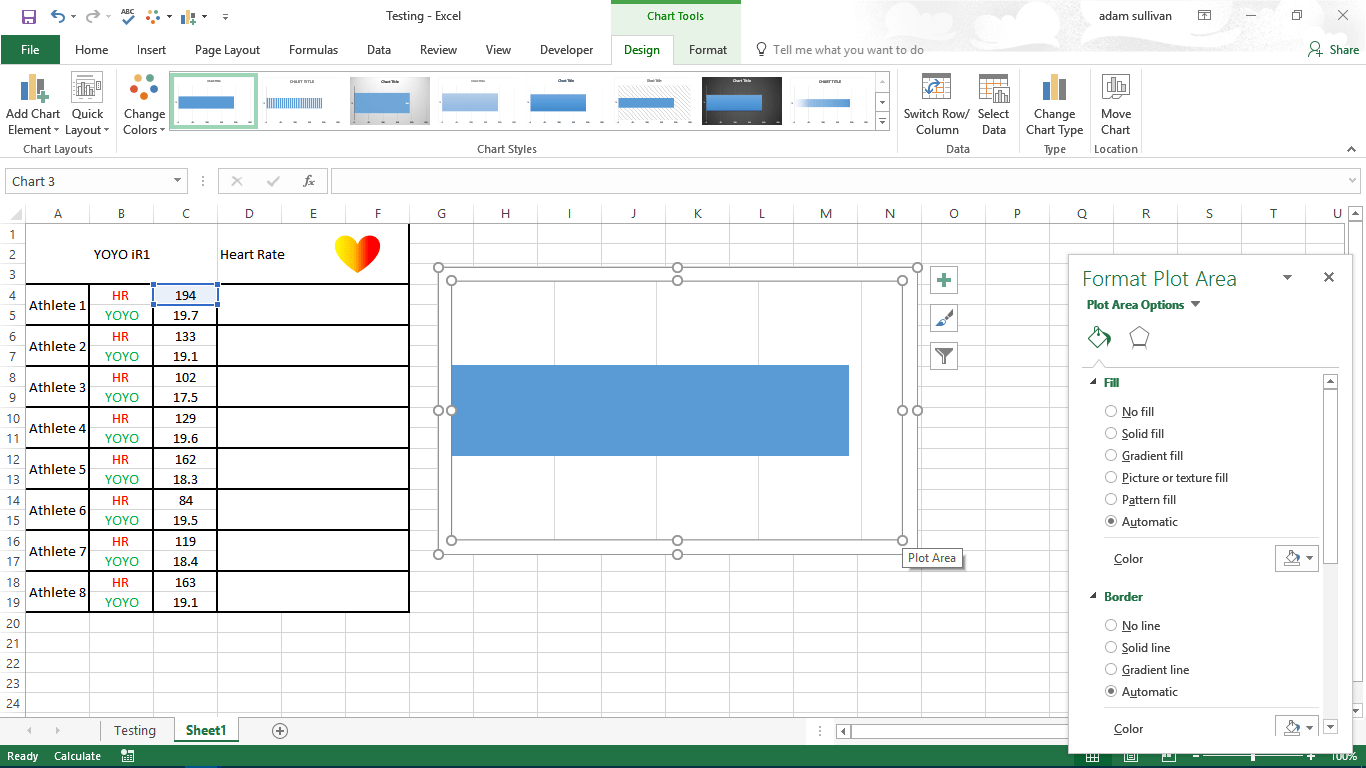
Once this is done, click on the bar chart and set the gap width to 0%, this makes the bar swell up to the full size of the chart area.
You can then shrink down the size of the chart to fit with a cell. Then, in the exact same format as the heart shape, you will apply a gradient fill to the bar chart.
Finally, select add chart element, and add a data label within the inside base of the data bar for a clearer illustration.

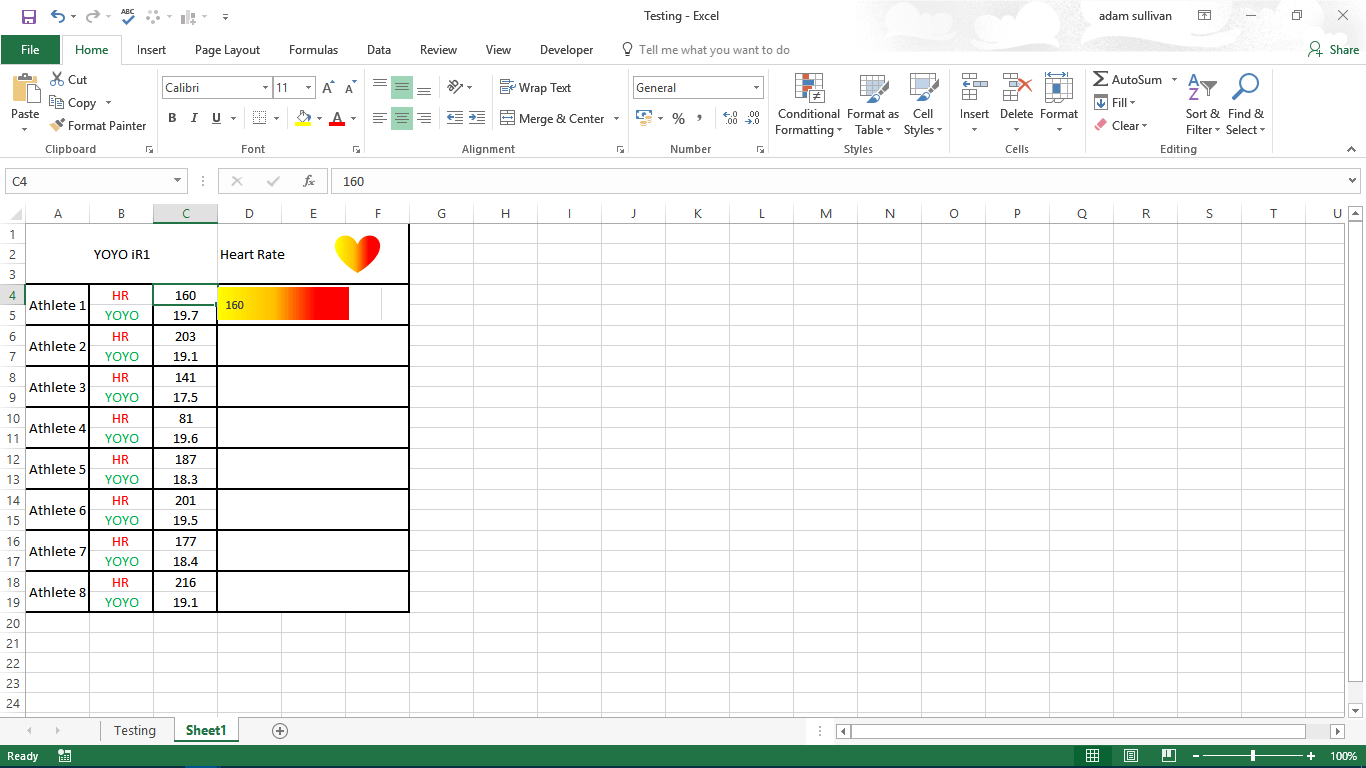
Then repeat this process for each of your athletes and you have a cool progress bar to illustrate your data!
You can also find this file to download here
